I develop websites and data visualizations. If you need to organize and present knowledge or to analyze and visualize data, I can help.
Find out moreI develop and manage web projects, whether based on WordPress or on custom content management frameworks.
Data analysis and data management with R, JavaScript, SQL; data visualization with D3.js; management and visualization of spatial data with Leaflet and Mapbox.
Management of collaborative development projects: code management, code review, project management, testing and code deployment.
Whether as part of larger web projects or to assist with existing ones, I can help manage web infrastructures through DevOps and configuration management tools to enable stable and fast delivery of web content.
Ready to start your next project with me? That’s great! Give me a call or send me an email and I will get back to you as soon as possible.
+44 79 1046 5692

I managed the 2.0 development cycle of the Pattrn data visualization and mapping web application, refactoring the legacy code from proof–of–concept stage to a modular ES2015 code base. I extended the app’s UX adding new chart types and allowing complex data sets to be explored and navigated. I created data processing pipelines, enabling Continuous Integration for reproducible deployments. I wrote user and developer documentation and set up infrastructure for developer collaboration (via GitHub, GitLab and Gitter).

I created Ansible infrastructure as code to allow seamless deployment of instances of the Pattrn data visualization and mapping platform.

An ongoing side project, Ninho is my family IOT hub, managing home heating, reporting indoor and outdoor temperatures from various VPN–connected locations to a Python Flask API via ESP8266 and SensorTag sensors, visualising temperature data with D3.js and storing it in a PostgreSQL database for ad-hoc analysis.

I developed data visualizations for the European MetroMonitor project using D3.js and NVD3, mapping the response and resilience of European cities to the 2008 financial crisis. I used R to process and analyze raw data, producing clean datasets ready to be used in the data visualizations.

Designed and developed the WordPress website for the LSE Cities research centre, using the Pods CMS plugin to manage complex content types. I wrote scripts to import content from the previous static website. I train and support content editors and develop new features as required by new research projects within the centre.

I designed and developed the WordPress platform used by the chapters of the Legambiente Lombardia environmental campaigning organization to publish local content. I host and manage the platform, providing support to editors and developing new features as requred. (photo credit https://flic.kr/p/9HyjGg)

I designed and developed the new WordPress website for the CRCS research centre, and I wrote scripts to import existing content from the centre’s legacy static website.
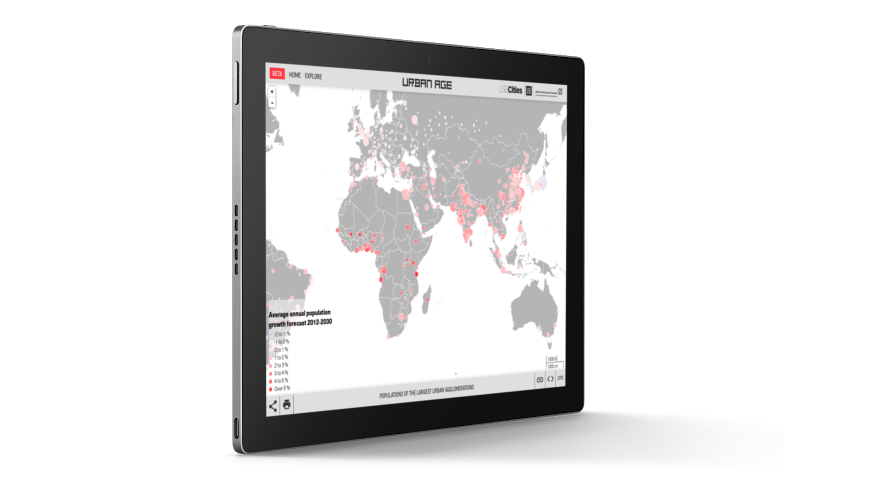
I am the internal technical lead at LSE Cities for the development of the new Urban Age platform, showcasing ten years of Urban Age research; I advise on technical architecture, coordinate code deployment and write code to integrate data visualizations within the core content management platform.

I write code to clean up and transform raw data into the formats needed for the web data visualizations of the Urban Governance survey platform. I developed asset pipelines for the project’s WordPress theme and extended the visualization code to support translations to other languages. I have added ServiceWorker to the second iteration of the platform, allowing the full website to be enjoyed offline.